ccording to the IBBA and M&A Source Q3 2025 Market Pulse Survey — the leading quarterly data set on lower middle market M&A, based on 247 completed transactions — the median multiple for businesses valued $5M–$50M was 5.5x in the third quarter of 2025. That figure held roughly 0.8 points above the start of 2025, reinforcing what the Q2 data had already shown: sustained investor demand for quality assets at scale.
Here is what the median hides. Inside that $5M–$50M band, a business producing $2M in EBITDA can price anywhere from roughly 3x at the low end to 8x at the high end depending on operational structure alone. On a $2M EBITDA base, that is the difference between an $8M enterprise value and a $16M enterprise value. Same revenue. Same profit. Same industry. Same quarter. A $5–8M gap in what the seller walks away with, determined not by performance but by the nine specific operational attributes underneath the profit.
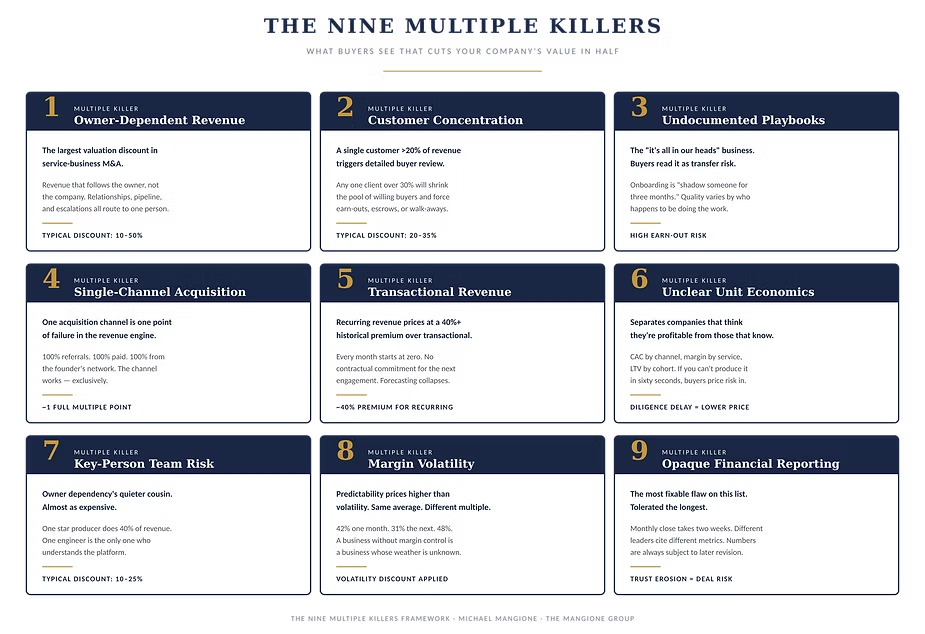
Those nine attributes are measurable, nameable, and fixable. I’ve spent twelve years inside growth-stage companies rebuilding exactly these nine things, and I’ve given them a name: The Nine Multiple Killers. This is the field guide to what they are, why institutional buyers punish each one, and — more importantly — why the same flaws that cut your eventual sale price are quietly costing you money every single month you own the company.
If you never plan to sell, this is still the most useful lens you will ever apply to your business. A buyer’s due diligence is just a brutally honest operational audit conducted by someone with financial incentive to find every flaw. Running that audit on yourself, before a buyer does it to you, is how you stop leaving money on the table every quarter for the rest of the time you own the business.
How Service Businesses Actually Get Valued (In Plain English)
Two-minute grounding. Skip if you already know.
When an acquirer values a service or operating business, they multiply a normalized earnings figure by a multiple that reflects how durable, transferable, and predictable they believe those earnings are. The earnings figure is usually SDE (seller’s discretionary earnings) for businesses with roughly $1M–$2M in EBITDA or below, and EBITDA for businesses above that. The multiple is where the real action happens.
The IBBA Q3 2025 Market Pulse Survey documents median multiples running from roughly 2x for the smallest businesses to 5.5x for businesses valued $5M–$50M. Inside any given band, the spread is wide. A $2M EBITDA business might price at 3x, 5x, or 8x depending entirely on the nine attributes below. On that same $2M EBITDA base, that is the difference between a $6M sale and a $16M sale.
Here is the part most founders miss: every one of the nine attributes that determines the multiple is also an operational lever you are working against, right now, this week, whether you sell or not. Owner dependency is not just a valuation discount — it is the reason you cannot take a vacation. Customer concentration is not just a buyer’s concern — it is the reason every renewal cycle feels like a coin flip. Tribal knowledge is not just a transferability problem — it is the reason your new hires take nine months to ramp instead of three.
Fix these things and your business is worth more if you sell. Do not sell, and fixing them still pays a compounding return for the rest of the time you own it.
Not all nine flaws carry equal weight. The first three drive most of the discount. The middle three produce meaningful but smaller compression. The final three are material but rarely deal-breaking in isolation. The diagnostic at the end of this piece weights them accordingly, and so should you.
Multiple Killer #1: Owner-Dependent Revenue
The single largest valuation discount in service-business M&A, and the one founders resist the longest.
What it is. Revenue that follows the owner, not the company. The founder is the primary business development engine. Key clients were signed by the founder, are managed by the founder, and would likely leave if the founder left. Every referral source in the network is a personal relationship. Every senior customer treats the founder as their account manager whether the org chart says so or not.
Why buyers punish it. Because when the owner walks, the revenue walks with them. The industry literature on this is remarkably consistent. Shannon Pratt, widely regarded as the leading authority on private company valuations, places the standard key person discount in the 10–25% range. In severe cases — a business where the founder is the primary rainmaker, the primary operator, and the primary customer relationship owner — analyses from Website Closers, Bennett Financials, and others have documented valuation discounts of 20–50%. Research published by Securis Advisory in early 2026 framed it bluntly: while independent businesses in the lower middle market routinely sell for 7–8x EBITDA, founder-dependent companies in the same segment commonly struggle to achieve 3–4x multiples.
Half the business’s value, gone, because of a structural problem the founder could have fixed years earlier.
What it costs you today. A founder-dependent business has a hidden tax: the founder cannot scale their own time. You work weekends. You cannot take a day off. Your pipeline ebbs the week you travel. Every new hire ramps into a company where the most important relationships are all on someone else’s phone, which makes them slower to contribute and faster to churn.
What fixing it looks like. Structural decoupling. A real account management layer that owns the client relationship on paper and in practice. Named handoffs with the largest accounts — a formal “you will now also work with [name], who will be your day-to-day point of contact.” Documented pipeline ownership by someone other than the founder.
One useful self-test: could this business run profitably for ninety days if I were completely unreachable? If the honest answer is no, the discount is sitting in your business whether you have measured it or not.
Multiple Killer #2: Customer Concentration
The flaw founders quietly hope buyers will not notice. Buyers always notice.
What it is. The percentage of revenue represented by your largest single customer, and your top three, five, and ten customers combined.
Why buyers punish it. The data is unambiguous. FOCUS Investment Banking’s 2025 analysis — published after they withdrew two separate lower middle market manufacturing businesses from sale in a single quarter due to concentration — documents that any single customer generating more than 20% of revenue triggers detailed buyer review, and above 30% concentration, buyers commonly reduce the transaction valuation by 20–35%. FOCUS also notes that concentrated businesses see a smaller auction field — fewer potential buyers bid, reducing competitive tension.
Eagle Rock CFO’s 2026 framework makes the mechanics more granular: moderate concentration of 20–30% from a single customer typically reduces multiples by 0.5–1.0x; severe concentration above 40% can reduce multiples by 1–2x or more. Morgan & Westfield’s 2025 guidance reports that businesses with 30–50% single-customer concentration frequently become unsalable without significant deal-protective structures like escrows, earnouts, or retention-based payments.
There is also a financing dimension most founders do not anticipate. SBA lenders, who finance a material share of lower middle market deals, commonly will not underwrite transactions where any single customer exceeds roughly 20% of revenue. Private equity firms generally flag anything above 15%. Concentration does not just reduce what buyers will pay — it shrinks the pool of buyers able to bid at all.
What it costs you today. Concentrated customers know they have leverage. They eventually use it — on pricing, on terms, on scope creep, on service demands a less-leveraged customer would not make. Founders with concentration problems spend a disproportionate share of their week managing those specific relationships, and the opportunity cost of that time is enormous.
What fixing it looks like. The cleanest fix is usually not shrinking the big customer — it is growing around them. If you can take a 30% customer down to 18% by expanding the rest of the book over 18–24 months, the risk profile changes materially. Keystone CPAs’ 2026 analysis frames this well: reducing concentration before going to market is the single highest-ROI preparation activity for most founders considering a sale, and for founders not considering a sale, it is still the single most important move for reducing the week-to-week fragility of the business.
Multiple Killer #3: Undocumented Operating Playbooks
The “it’s all in our heads” business. Second most expensive valuation killer, because buyers interpret it as direct transfer risk.
What it is. The company runs, and runs well, but almost nothing is written down. Sales is executed from instinct. Operations is executed from muscle memory. Onboarding a new hire means “shadow someone for three months.” The business works because the specific humans currently in the building know how it works.
Why buyers punish it. Because when they take over, they are inheriting a liability, not an asset. They cannot train new people into the roles. They cannot enforce consistency. They cannot identify where margin is leaking. They are, in effect, buying a business they cannot actually operate without the original people — which puts them right back into Multiple Killer #1 but for the whole company, not just the founder. The M&A due diligence literature consistently identifies tribal knowledge as one of the most common reasons buyers either walk or restructure deals toward retention-weighted earn-outs rather than up-front cash.
What it costs you today. New hires take two to three times longer to become productive than they should. The same problems resurface every six months under different names because nobody has written down how they were solved last time. Quality varies customer to customer, engagement to engagement, sometimes dramatically, because every person on the team is executing their own mental model of what “good” looks like.
What fixing it looks like. Documented playbooks for the operating workflow — sales, delivery, onboarding, escalations, quarterly planning, financial close. Not fifty-page process manuals. One-pagers with the actual steps, the actual owners, the actual tools, and the actual handoffs. A new hire in any seat should be able to read the playbook for that seat and know what “winning” means in the first week, not the third month.
A Real Example: What Rebuilding the Top Three Killers Looks Like
This is a transferability story, not a growth story. The growth happened because the transferability happened.
When I started working with a home inspection company, the business had five inspectors and $1.2M in annual revenue. On paper, fine. Underneath the revenue, almost every attribute on this list was present. The founder was the sales engine, the operations manager, and the final decision-maker on every customer issue. Onboarding was informal. Service tiers were not standardized. There was no playbook a new inspector could read on day one. Customer complaints went straight to the founder. Growth had stalled — not because demand was weak, but because the operating layer physically could not absorb more volume without breaking.
The engagement focused on exactly the first three Multiple Killers. A fourteen-day structured onboarding program replaced the “shadow someone” approach (Killer #3). A W-2 plus 1099 hybrid workforce model made capacity flexible without destroying unit economics (more on that hiring model here). Three standardized service tiers — base, premium with thermal imaging, and full inspection with radon and mold — replaced ad-hoc pricing (also Killer #3). The founder stopped being the first call on every customer issue and started being the third (Killer #1).
The performance lift that followed was real. Over the six months of the engagement, annual revenue moved from $1.2M to roughly $4.8M. Inspector headcount grew from 5 to 30. Average ticket moved from $385 to $575 on the back of the tiered structure. Google reviews went from 34 to 287, because delivery quality finally became consistent enough across inspectors to be worth asking for reviews on.
Those are the numbers that make the case study legible. But the real shift — the one that actually mattered to what this business would be worth to a buyer — was that the business moved from a founder-extension to a transferable operating system. Same company, structurally different asset class. A buyer could now step into it without the operating layer collapsing. That is the property buyers pay for. Revenue growth alone does not produce it; structural decoupling does. The numbers above are what happened because the transferability was built, not the other way around.
Multiple Killer #4: Single-Channel Customer Acquisition
Founders with a great channel almost always underestimate how much this one costs them.
What it is. All new customers come from one place. One hundred percent from referrals. One hundred percent from a single paid channel. One hundred percent from the founder’s network. The channel works — that is usually why it dominates in the first place. But it works exclusively.
Why buyers punish it. Because single-channel acquisition is structurally the same risk as customer concentration. BMI Mergers’ analysis of lower middle market M&A documents that buyers evaluate “selling-channel concentration” as a distinct form of concentration risk alongside customer concentration — the underlying concern is identical, namely that a single point of failure in the revenue engine makes earnings less durable and less transferable. When concentration of either type is present, BMI documents the typical buyer responses: extended due diligence, revised payment structures toward multi-year earnouts tied to revenue retention, and extended owner transition periods. FOCUS Investment Banking notes in its 2025 concentration analysis that businesses most commonly develop concentration issues by relying on inbound sales inquiries from a single ecosystem — exactly the pattern a single-channel acquisition business exhibits.
In practice, single-channel businesses typically price in the lower band of their industry’s multiple range until a second scaled, measurable channel is operational. The pool of willing buyers narrows, deal structure shifts away from up-front cash toward retention-weighted payments, and the multiple compresses.
What it costs you today. Single-channel dependency creates quiet fragility. A referral drought does not look like anything for the first two months, and then suddenly your pipeline is empty and you have no second engine to throttle up. Worse, single-channel businesses rarely know their true unit economics per channel — they have only one channel to measure against itself, so CAC drift and efficiency erosion tend to go unnoticed until they are expensive.
What fixing it looks like. A deliberate second channel built over 12–24 months. Not a panic hire of an agency. A structural investment in a second durable source of new customers, measured the same way the first one is measured, scaled until it represents at least 25–30% of new business.
Multiple Killer #5: Transactional Revenue (When It Could Be Recurring)
The structural flaw founders often shrug at because “that is just the nature of our business.” The data disagrees.
What it is. Revenue booked one engagement at a time — one project, one purchase, one delivery — with no contractual commitment for the next one. Compare to recurring revenue: retainers, subscriptions, long-term contracts, renewable maintenance agreements. Revenue that, by structure, is more likely to repeat.
Why buyers punish it. Because recurring revenue is more predictable, and predictability prices higher. Aventis Advisors’ 2015–2026 analysis of more than 1,000 software M&A transactions documented the SaaS-vs-non-SaaS valuation premium historically running at 40% or more, driven almost entirely by the predictability of recurring revenue. The SaaS Capital Index, which tracks the median public SaaS company ARR multiple, stood at roughly 6.7x ARR as of June 2025 — and while the comparison between public SaaS and private service businesses is not apples-to-apples, the mechanism is: buyers pay more for revenue that is contractually likely to recur.
That premium translates downward into non-software services. A service business with 60–70% recurring revenue almost always prices at a materially higher multiple than the same business inverted, even with identical P&Ls today.
What it costs you today. Transactional businesses live on the treadmill. Every month starts at zero and has to be re-earned. Capacity planning is nearly impossible. Hiring is reactive. Revenue volatility drives operational volatility drives team stress drives churn.
What fixing it looks like. Wherever possible, converting transactional offers into retainer, subscription, or framework-agreement structures. Adding recurring-revenue products to an otherwise project-based business — monthly maintenance, ongoing support, advisory retainers, managed services. Even moving from 0% recurring revenue to 25–30% is a step-change in how the business prices and how it operates.
Multiple Killer #6: Unclear Unit Economics
The flaw that separates companies that think they are profitable from companies that know they are.
What it is. A business where the founder cannot, in under sixty seconds, tell you what the average customer costs to acquire, what they contribute in gross margin, how long they stay, and what they are worth over their lifetime. If the answer is “it depends” or “I’d have to pull that,” the business is operating without a map of its own economics.
Why buyers punish it. Because they need to underwrite the future. A buyer is trying to model what the business will produce in cash flow over the next five to seven years. If the seller cannot produce clean unit economics, the buyer either builds them from scratch during due diligence — which is expensive, slow, and usually produces worse numbers than the seller believes — or prices in extra risk to compensate for what they cannot see. Both outcomes lower the price.
What it costs you today. Without unit economics, every significant business decision is a guess. Pricing decisions, channel decisions, hiring decisions, service-line decisions — all of them become intuition exercises instead of math exercises. The companies that compound are the ones that know their numbers to the customer level and act on them.
What fixing it looks like. A monthly operating review that reports, at minimum: CAC by channel, gross margin by service line, gross margin by customer cohort, and retention/LTV by customer cohort. Not every company needs a full finance function to produce this. Every company needs the four numbers.
Multiple Killer #7: Key-Person Team Risk
Owner dependency’s quieter cousin, and in many companies nearly as expensive.
What it is. A single non-owner employee represents a disproportionate share of the company’s delivery capacity, sales capacity, or institutional knowledge. One star producer responsible for 40% of revenue. One engineer who is the only person who understands the platform. One account manager through whom all the top clients have historically run. One operator who has been there since founding and silently holds most of the knowledge the playbooks do not capture.
Why buyers punish it. Same logic as owner dependency, different person. The valuation literature — including the Brady Ware framework on key person discounts published in 2024, and Locked On Leadership’s 2026 analysis — documents that while publicly-traded company studies put the key person discount at around 10%, the discount for privately-held service businesses commonly runs 15–25% and can approach 100% in extreme cases where the business is effectively an extension of one specific individual. Buyers either apply a direct multiple reduction, require employment agreements from the key person as a condition of closing, or both.
What it costs you today. Key-person risk makes the business less scalable and much more expensive to operate than it needs to be. Star producers know their value and price accordingly. Their bad days become the company’s bad days. Their eventual departures — and they do eventually depart — are catastrophic events rather than manageable transitions.
What fixing it looks like. Structural distribution of what the key person knows and does. A second person being trained in the platform. A second person being introduced into the top accounts. A documented approach to the star producer’s sales process so the next person can execute a recognizable version of it. You do not need to replace the key person. You need to make sure you could.
Multiple Killer #8: Margin Volatility
The flaw hiding in plain sight on the P&L that most founders have stopped noticing.
What it is. Gross margin and operating margin that swing materially month to month and quarter to quarter for reasons the finance team cannot cleanly explain. 42% one month. 31% the next. 48% the one after. The founder says “that was a weird quarter.” There is a story for each swing. Individually the stories make sense. Collectively they describe a business without margin control.
Why buyers punish it. Volatility is uncertainty, and uncertainty prices lower than predictability. A business that delivers 38% gross margin every quarter for three years is worth more than a business that averages 40% gross margin but swings between 28% and 52% getting there. Same average. Different multiple. Sometimes dramatically different.
Three structural causes account for most margin volatility, and each has a specific operational fix:
-
Pricing inconsistency — every deal is priced differently and mix movement swings margin. Fix: standardized pricing architecture.
-
Scope creep — contracts under-scope the actual delivery cost. Fix: scoped statements of work with explicit change-order protocols.
-
Demand lumpiness against fixed capacity — you are either starved or overloaded, never right-sized. Fix: flexible capacity models (a hybrid W-2/1099 workforce, or tiered delivery).
What it costs you today. You cannot plan. You cannot hire with confidence. You cannot invest in growth initiatives, because the next quarter’s margin will determine whether you can afford them. You are running a business whose weather you cannot forecast — and every operating decision carries hidden risk as a result.
Multiple Killer #9: Opaque or Manual Financial Reporting
The most fixable flaw on this list, and the one most businesses tolerate the longest.
What it is. The business cannot produce a clean, accurate monthly financial package within five business days of month-end. The numbers that do come out are subject to later revision. Different members of the leadership team reference different versions of the same metrics. The founder or CFO spends two days every month reconciling spreadsheets against the accounting system before anything can be trusted.
Why buyers punish it. Because it tells them the business does not yet have a finance function mature enough to support the scale it is operating at. Due diligence will uncover this in the first week and slow the entire process down while the buyer’s team either builds clean numbers themselves or waits for the seller to produce them. Every week of delay increases deal risk. Every discovered inconsistency erodes buyer trust, and trust, once eroded, lowers the price.
What it costs you today. If you cannot see your numbers cleanly, you cannot manage them. Late reporting becomes stale reporting becomes irrelevant reporting. Decisions get made on gut instead of evidence. The cost is not just the exit multiple. It is every decision in between now and then. (See also: the fractional CFO work that sits underneath this.)
What fixing it looks like. A monthly close process that produces clean financials within five business days. A standardized reporting package that does not change month to month. A source-of-truth accounting system nobody works around. For most growing companies this is a six-to-twelve-month operational project, and the return on investment — in decision quality alone, not counting the eventual valuation premium — is one of the highest available anywhere in the business.
Buyers don’t pay for what you built. They pay for what survives without you.
The Nine Multiple Killers Self-Diagnostic
The nine flaws do not carry equal weight, and this diagnostic is structured to reflect that. Score each killer from 0 to 3, then read the scoring rules carefully — total score alone does not tell the whole story.
Scoring scale (all nine):
-
0 — Flaw is materially present. A buyer would flag it in the first hour of diligence.
-
1 — Flaw is partially present. A buyer would note it and likely apply a discount.
-
2 — Flaw is largely mitigated. A buyer would verify but not discount heavily.
-
3 — Flaw is fully addressed. A buyer would see it as a positive attribute.
Tier 1 — Severe-discount killers (drive most of the multiple compression)
-
Owner-dependent revenue — score 0–3
-
Customer concentration — score 0–3
-
Undocumented operating playbooks — score 0–3
Tier 2 — Moderate-discount killers (meaningful multiple compression)
-
Single-channel customer acquisition — score 0–3
-
Transactional (vs. recurring) revenue — score 0–3
-
Unclear unit economics — score 0–3
Tier 3 — Material discount killers (real but rarely deal-breaking in isolation)
-
Key-person team risk — score 0–3
-
Margin volatility — score 0–3
-
Opaque financial reporting — score 0–3
How to read your score
Total range: 0–27. But the total is not the primary signal. The primary signal is how many Tier 1 killers you scored 0 or 1 on. Buyers do not net out flaws across tiers — a perfect score on Tier 3 does not offset a critical flaw in Tier 1.
-
Zero Tier 1 flags (all three scored 2 or 3), total 22–27: Structurally healthy. Most of your operational leverage is in optimization, not fundamental repair. You are likely pricing near the top of your industry multiple range.
-
Zero Tier 1 flags, total 14–21: Healthy on the severe flaws; meaningful work to do on the middle and lower tiers. Probably mid-range on the multiple, with room to move up.
-
One or more Tier 1 flags (any Tier 1 killer scored 0 or 1): The real money is sitting in those flags, regardless of total. A Tier 1 killer scored at 0 can cost more multiple compression than perfect scores on Tiers 2 and 3 combined can recover. Fix the Tier 1 flags first.
Most founders score themselves one to two points higher on each killer than a buyer would. Factor that in — and when in doubt, score down.
Why the Real Fix Is Not a Consultant
Founders who recognize some or all of these flaws almost always reach for the same first move: hire a management consultant to diagnose the problems and produce a roadmap to fix them.
Consultants are excellent at the first part — diagnosis — and structurally weak at the second. A roadmap is not a rebuild. A strategy deck is not an operating playbook. An assessment is not an account management layer. Fixing any of the nine flaws above requires embedded, ongoing, cross-functional operating work inside the business for 6–18 months. It requires someone with authority to redesign processes, change how people are accountable, and own the outcome end-to-end.
That is the work I do, for what it is worth. The Mangione Group is a fractional executive firm that embeds a senior operator across sales, marketing, operations, and technology — plus a bench of 20+ specialized experts who execute alongside the rebuild. The reason I mention it here is not to turn this article into a pitch. It is to be honest about the gap: the nine flaws above do not get fixed by a deck. They get fixed by someone being accountable for fixing them, week over week, until the operating layer of the business is materially different than it was when they walked in.
Whether that is a fractional executive, a full-time operator, or a determined founder running the rebuild themselves, the mechanics are the same. The flaws are structural. The fix is structural. The returns are structural.
The Starting Point: An Ownership Gap Diagnostic
If any of the nine flaws landed uncomfortably close to home — particularly in Tier 1 — the first move is not hiring anyone. It is understanding which gaps are actually costing you the most, and whether any of them are a fit for outside help at all.
I do brief calls with owners all the time. The output is a written ranking of the three most expensive operational gaps in your business right now and whether each one is actually a fractional fit or a different kind of hire (full-time executive, specialist, agency, or no outside hire at all). It is free, specific, and honest — which means there is a real chance the answer is “your situation is not a fit for a fractional engagement, here is what is.”
Request the Ownership Gap Diagnostic →
Frequently Asked Questions
How do private equity firms actually calculate a business multiple?
Institutional buyers apply a multiple to a normalized earnings figure — typically SDE (seller’s discretionary earnings) for sub-$2M EBITDA businesses and EBITDA for larger ones. The multiple reflects how durable, transferable, and predictable the earnings are. The IBBA Q3 2025 Market Pulse Survey reported median multiples of roughly 2x for the smallest businesses up to 5.5x for businesses valued $5M–$50M. Specific operational attributes — owner dependency, customer concentration, recurring revenue percentage, documentation quality, unit economics clarity — then move the multiple inside or outside that baseline range. Two businesses in the same industry with the same earnings routinely price at a 2x difference in multiple based on those attributes alone.
What is the biggest valuation killer in a service business?
Owner-dependent revenue. It consistently produces the largest multiple discount, and it is the flaw sellers resist diagnosing the longest because, by definition, the business has been working well with the owner at the center of it. Industry research documents key person discounts in the 10–25% range for typical cases, with severe cases reaching 20–50% or higher. Practically, this often manifests as the gap between a 7–8x multiple for a structurally-independent lower middle market business and a 3–4x multiple for a founder-dependent one in the same segment. Customer concentration is second — FOCUS Investment Banking documents 20–35% valuation discounts when a single customer exceeds 30% of revenue. Undocumented operating playbooks is third.
I am never going to sell. Does any of this matter to me?
Yes — and more than founders typically realize. The flaws that cut a business’s sale multiple are the same flaws costing the founder time, money, and stress every month they own the company. Owner dependency is why you cannot take a real vacation. Customer concentration is why every quarter feels like a coin flip. Tribal knowledge is why onboarding a new hire takes nine months. Opaque reporting is why you are making decisions on feel instead of numbers. Whether you sell or not, fixing these problems pays a compounding return for the rest of the time you own the business.
What kind of business actually gets a premium multiple?
The structural attributes that drive a premium multiple are consistent: at least 40–60% recurring or contracted revenue, no single customer above 15% of total revenue, low owner dependency on the top-line, a documented operating system that survives employee turnover, at least two scaled and measurable acquisition channels, clean unit economics producible in under an hour, margin stability within a tight band quarter over quarter, and a finance function that produces a clean monthly close in under five business days. A business that checks most of those boxes prices at the high end of its industry’s multiple range. A business that checks few of them prices at the low end, regardless of revenue.
How long does it take to fix these flaws?
Most are 6–18 month operational rebuilds, not 30-day projects. Owner dependency and customer concentration typically take 12–24 months to materially shift. Documentation, unit economics, and financial reporting can usually be meaningfully improved inside 6 months. Margin volatility and key-person risk depend heavily on what is driving them. Sequencing matters — fixing financial reporting first makes every subsequent fix measurable, which is why it is often the first thing a serious operating engagement tackles.
Should I fix these before I try to sell, or let the buyer discount for them?
Fix them first, unless you are operating on a forced timeline. The math favors the fix almost every time. A 1-to-2-point multiple improvement on a $2M EBITDA business is $2M–$4M of additional enterprise value, which almost always dwarfs the cost of the 12–18 months of operational work required to earn it. The exception is a forced sale — health, partnership dispute, burnout — where time does not allow for the fix. In every other situation, the cleanest business wins the auction, and the cleanup is nearly always worth it.
About the Author
Michael Mangione is the founder and CEO of The Mangione Group and the author of The Unstuck Method. He is the creator of the Ownership Gap Diagnostic, the Three Ceilings framework, and the Nine Multiple Killers framework.
For twelve years, he has embedded as a fractional executive inside growth-stage companies — rebuilding the operating layer across sales, marketing, operations, and technology — across real estate, legal, marketing, technology, home services, agriculture, manufacturing, and professional services. The Mangione Group deploys a bench of 20+ specialized operators, including a 20-year operations expert and 25+ marketing specialists, to deliver full-time outcomes on fractional time.
The Mangione Group has cultivated a powerful network of professionals whose insights have been featured in The New York Times, CNN, Fortune, Entrepreneur, Inc., Bank of America, Ritz-Carlton, Samsung, and more.
Connect: LinkedIn · The Mangione Group · Mike@TheMangioneGroup.com · +1 (844) 435-1656
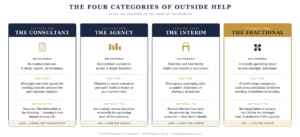
Related reading: The Three Ceilings: Why Companies Plateau at $3M, $10M, and $25M · Fractional vs. Consultant vs. Agency vs. Interim: A Decision Framework · The Definitive Guide to Fractional Leadership
Sources cited in this article: IBBA and M&A Source, Market Pulse Survey Q2 and Q3 2025 (July and October 2025 editions, based on 272 and 247 completed transactions respectively); FOCUS Investment Banking, “The Perils of Customer Concentration in M&A” (2025); Eagle Rock CFO, customer concentration risk framework (January 2026); Morgan & Westfield, “Reducing Concentrations of Risk Before Selling Your Business” (2025); Keystone CPAs, “How Buyers Actually Underwrite Customer Concentration” (2026); BMI Mergers & Acquisitions, concentration-risk analysis for lower middle market businesses; Shannon P. Pratt, Business Valuation Discounts and Premiums; Brady Ware, “Managing Key Person Risk” (2024); Locked On Leadership, “Key Person Discount: Reduce Founder Risk Years Before Exit” (March 2026); Website Closers, “Effects of Owner Dependence on a Business Valuation” (2026); Bennett Financials, “The Key Man Discount” (March 2026); Aventis Advisors, SaaS Valuation Multiples 2015–2026 M&A dataset; SaaS Capital Index, June 2025 edition; Calder Capital, Q1 2025 Lower Middle Market M&A Report incorporating IBBA, Dealstats, BizBuySell, Peercomps, GF Data, and Axial data.